The Talenteria landing page is the first page that opens once you've signed in to Talenteria.
This page shows various charts with statistics on your career sites, candidates, job openings, and site visitors. You can always return to the landing page by selecting the  icon.
icon.
Note
To get career site statistics for the charts on the landing page, integration of Talenteria with Google Analytics is used. For data to be collected for your career sites, ensure that the Google Analytics settings are configured for all your sites. Optionally, in the general system settings, you can configure the charts to display demo data, not based on real statistics, to see how data on charts may look like.
Charts
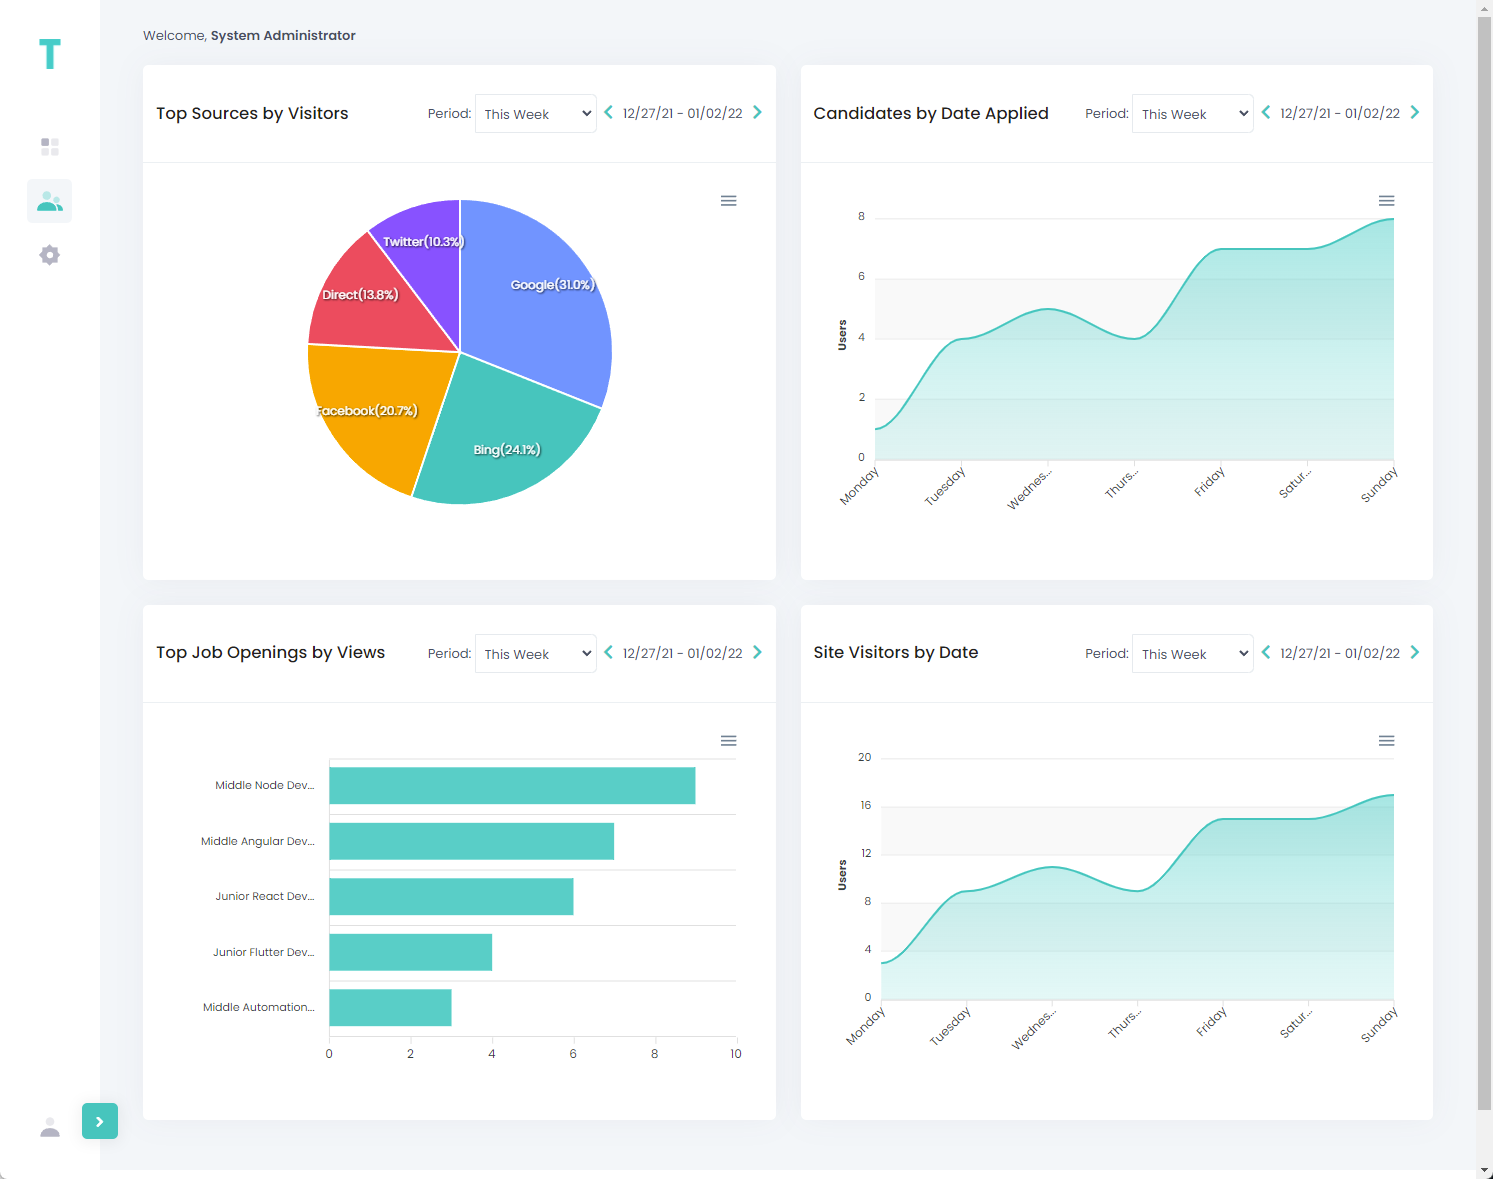
The following charts are available on the home page:
- Top Sources by Visitors – This chart shows how many people in percentage terms visited your career site(s) from every source for a specific period.
- Candidates by Date Applied – This chart shows how many candidates applied for job openings on your career site(s) and when for a specific period.
- Top Job Openings by Views – This chart shows how many views the most popular job openings had for a specific period.
- Site Visitors by Date – This chart shows how many visitors your career site(s) had for a specific period.
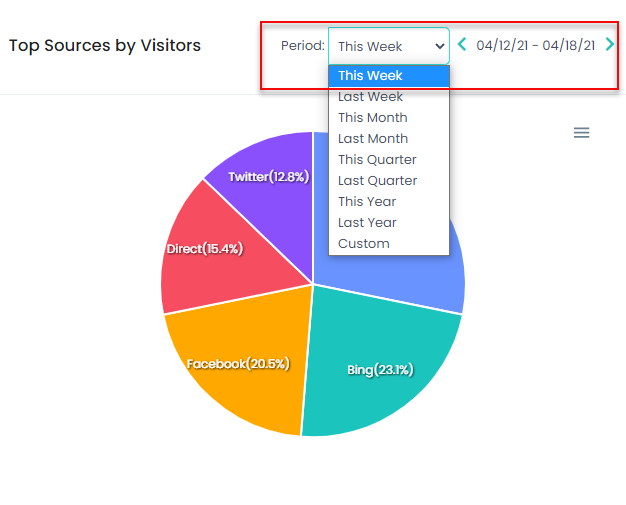
Changing chart statistics period
The statistics on every chart is shown for a specific period. At the top of the chart, you can choose the period length, and then navigate between periods.
Downloading chart data
You can download any dashboard in the SVG, PNG, or CSV format by selecting the ![]() icon in the dashboard top right corner, and then selecting the corresponding option.
icon in the dashboard top right corner, and then selecting the corresponding option.